
Merging field and lab data in spreadsheets.
Charting every well and analyte by hand.
Second-guessing every spike.
Still doing it all by hand?
Catch real groundwater trends early and cut false alarms, with field and lab data from every well in one place.
aQRate is groundwater monitoring software. Collect field readings in the app, bring in lab results, and test every well and analyte for statistically significant trends (Mann-Kendall and Theil-Sen), so you can tell a real change from noise.
Up to 50% less admin time. Based on internal benchmarks. Results vary by workflow.The old spreadsheet method fails groundwater programs
Spreadsheets are slow and invite copy-paste errors when a decade of field and lab data sits across many wells.
Simple trendlines assume normal, independent data. Groundwater data is noisy, seasonal and full of outliers.
A missed change means a contaminant moves off-site. A benign spike means a costly false alarm.
See what a spreadsheet trendline does with noisy iron data
Iron is one of the most volatile analytes in a lab suite. Below is the same synthetic iron series from the demo dataset, read two ways.
Spreadsheet linear trendline
Mann-Kendall on the same data
What changes for your monitoring program
The same quarterly rounds, the same labs, the same wells — without the spreadsheet rebuild between them.
Up to 50% less admin time.
Based on internal benchmarks. Results vary by workflow.Trend tests run on the data you already collect. Field readings land in the project as they are captured, lab results import against their sample IDs, and the Mann-Kendall and Theil-Sen statistics run there — instead of being rebuilt in a spreadsheet every quarter.
Fewer investigations triggered by benign spikes, and less rework re-merging field and lab data by hand. When a spike is statistically flat, you do not mobilize a crew to chase it.
Mann-Kendall and Theil-Sen suit noisy, seasonal, outlier-prone data, so a real trend is separated from noise without assuming a normal distribution. The wells that changed get attention; the ones that did not, do not.
From wellhead to trend result
A short overview of the aQRate components behind a groundwater monitoring project.The field-to-trend pipeline
Two data sources, one project per well, statistics on every analyte, dashboards for review.
Field readings — depth to water, EC, pH, temperature — captured in the mobile app at the wellhead.
Lab results — TDS, major ions, heavy metals — imported against their sample IDs.
One project — every well's field and lab data together
Mann-Kendall trend test + Theil-Sen slope — every well, every analyte
GW Monitoring Dashboard + Groundwater Monitoring Field Ledger (PDF)
Collect at the wellhead
Open the Groundwater Monitoring form in the aQRate mobile app: pick the well ID, capture the GPS pin, log the monitoring date and sample ID, and record the field readings.
Bring in lab results
Lab suites — TDS, major ions, heavy metals — import against each sample ID, so every well's field and lab data sit together in one project.
Run the statistics
Mann-Kendall and Theil-Sen test every well and analyte for statistically significant trends, without assuming normal data and without being thrown off by outliers.
Review and report
The AI-based Visualization tool builds dashboards paired with the statistical analysis, and the Groundwater Monitoring Field Ledger turns the record into a PDF.
The Groundwater Monitoring template, on a phone
A ready-made workspace with the monitoring form, the GW Monitoring Dashboard and the Groundwater Monitoring Field Ledger. Watch the real form build itself and fill in — then scroll inside the phone screen to reach every field.
Groundwater Montiring Repeat Form
Well ID *
Well Location*
Monitoring Date*
Sample ID*
TDS
Chloride
Calcium
Iron
Arsenic
Benzene
Toluene
Ethylbenzene
Groundwater Montiring Repeat Form
MW-10
53.54519, -113.47721
2025-12-31T00:00:00.0000000Z
SAMP-MW-10-20251231
—
—
—
—
—
—
—
—
Report ready: Groundwater Monitoring Field Ledger
One submitted record, as it lands in the project
Illustrative demo data, not customer data.MW-02
GPS pin captured at the wellhead
Jun 26, 2025
SAMP-MW-02-20250626
612 mg/L
48 mg/L
87 mg/L
0.35 mg/L
0.0051 mg/L
Not detected (below 0.0005 mg/L)
Not detected (below 0.0005 mg/L)
Not detected (below 0.0005 mg/L)
What the trend analysis finds in a 10-year record
A synthetic 10-year quarterly monitoring program across three wells. Field indicators: depth to water, EC, pH, temperature. Lab suites: TDS, major ions and heavy metals.
Synthetic demo dataset. Illustrative only, not customer performance data.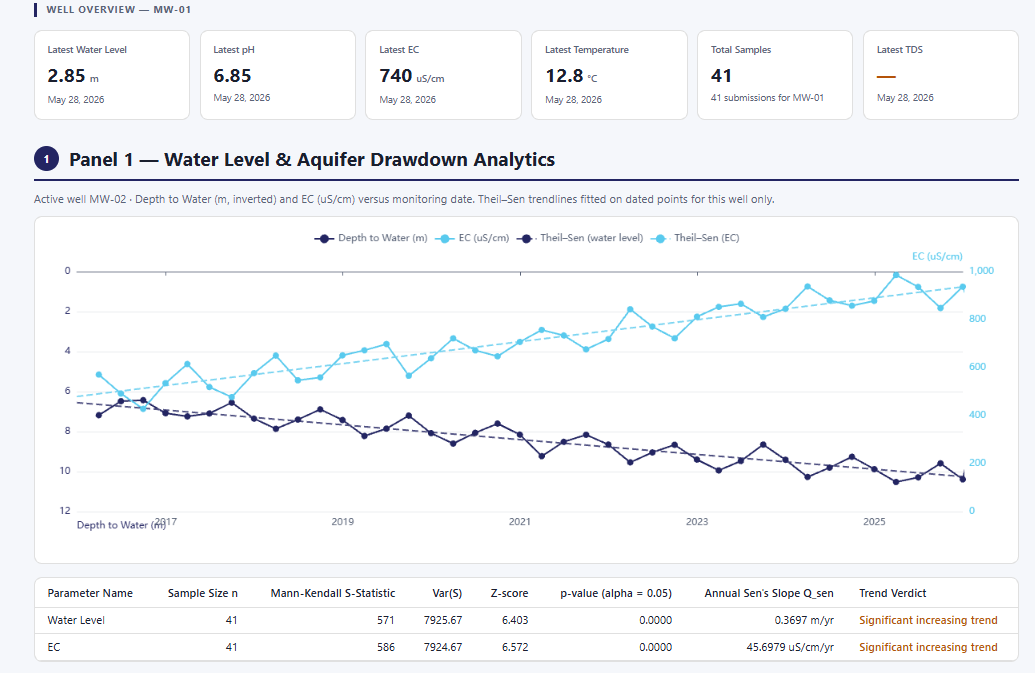
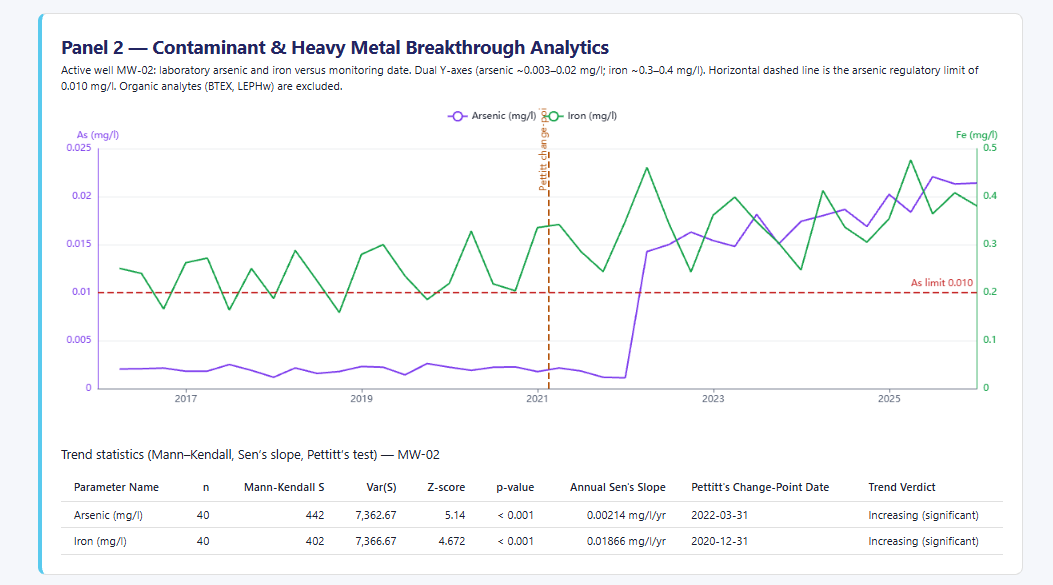
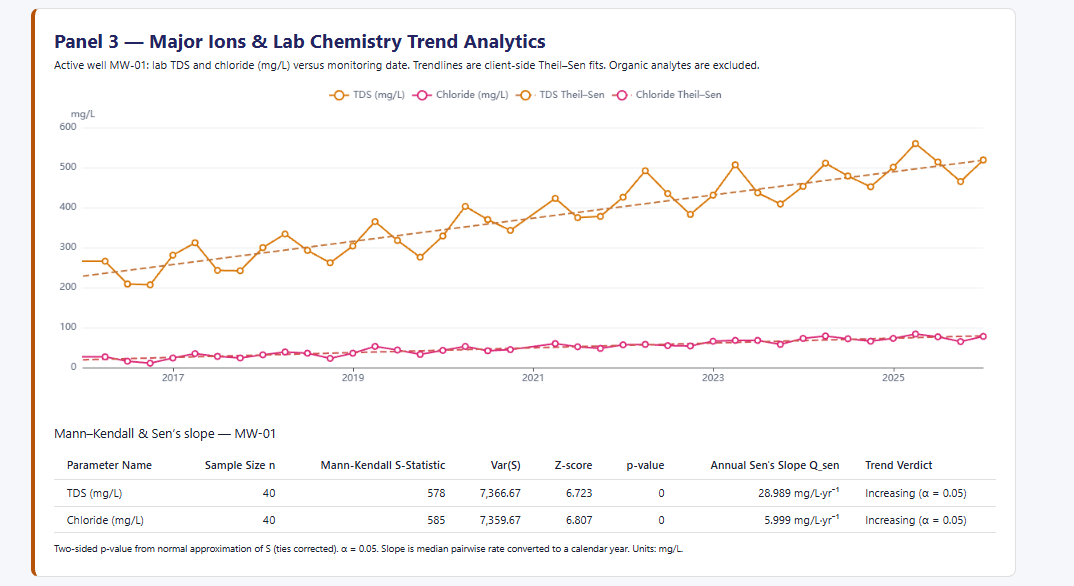
These visualizations are an example of the end goal. The workflow depends on aQRate's data collection and data management.
aQRate does not make regulatory compliance determinations or interpret what a trend means for a site. Statistical results support review. Interpretation and decisions stay with the qualified professional and the regulator.Built for your regulatory limits, in Alberta or anywhere
In Alberta, groundwater programs often work to limits set in their approval conditions and in guidelines such as the Alberta Tier 1 Soil and Groundwater Remediation Guidelines. The trend analysis is not tied to one jurisdiction, so you can apply it against your own regulatory limits, in Alberta or anywhere else.
aQRate's Visualizations module and QA/QC workflows can be adapted to your regulatory needs: the analytes, units and formats your program reports against, whether you work to approval conditions, the Alberta Tier 1 guidelines, or your own limits in another jurisdiction.
Deciding what a trend means for a site, and whether a program meets its limits, stays with the qualified professional and the regulator.
Dashboards built around your analytes, units and reporting format
Field and lab data reviewed together for QA/QC before trends run
Trend results and ledgers shaped to the framework your program works to
Who signs off with aQRate
The people accountable for monitoring programs — and the ones who answer for them.
Environmental consulting principals
Run monitoring programs across many sites without a spreadsheet under each one. Every well's field and lab record is captured once and stays in one project, and the trend statistics are already run when it is time to write the report.
Site environmental and compliance managers
Quarterly rounds, approval conditions, and a regulator's questions to be ready for. The record from each sampling event is captured at the wellhead, linked to its sample ID, and stays review-ready from field to ledger.
Hydrogeologists
Review interconnected indicators — depth to water, EC, TDS — across the whole network on one dashboard, and spend interpretation time on the wells where the statistics say something changed.
Getting started
From signup to your first trend dashboard, with the template doing the setup.
1
Start your free trial
Opens a workspace with the Groundwater Monitoring template already chosen: the monitoring form, the GW Monitoring Dashboard, the Groundwater Monitoring Field Ledger, and sample records to explore.
2
Put the app in the field
Crews open the form at the wellhead on iOS or Android, capture the GPS pin and sample ID, and record the field readings.
3
Bring the lab results in
Import lab suites against their sample IDs, then review the trend dashboards with your team and take the statistics into your next report.
Questions we get from monitoring programs
How much time and money can this save?
In internal benchmarks, aQRate cut admin time by up to 50%. Results vary by workflow. The dollar impact depends on your wells, sampling frequency and rates, and we do not publish a dollar figure.
What are the Mann-Kendall test and the Theil-Sen slope?
In plain words: Mann-Kendall is a trend test that checks whether a series of readings is genuinely going up or down over time, and Theil-Sen estimates how fast. Neither assumes the data is normally distributed, and neither is thrown off by a few extreme outliers, which is why they suit noisy, seasonal groundwater data.
Why not just use a spreadsheet trendline?
A spreadsheet's linear trendline assumes the data is normally distributed and independent over time. Groundwater data rarely is: it is noisy, seasonal and full of outliers. Fit a trendline to that and you can read a trend into a benign spike, or miss a real change.
Does aQRate work with my regulatory limits, and does it decide compliance?
The trend analysis is not tied to a jurisdiction, so you can apply it against whichever limits apply to your program, in Alberta or elsewhere. aQRate does not determine compliance; that stays with the qualified professional and the regulator.
What data does the demo use?
A synthetic dataset built to show the platform: a 10-year quarterly monitoring program across three wells, with field indicators and lab suites. It is illustrative only, not customer performance data.